By Marcos Pérez Talia
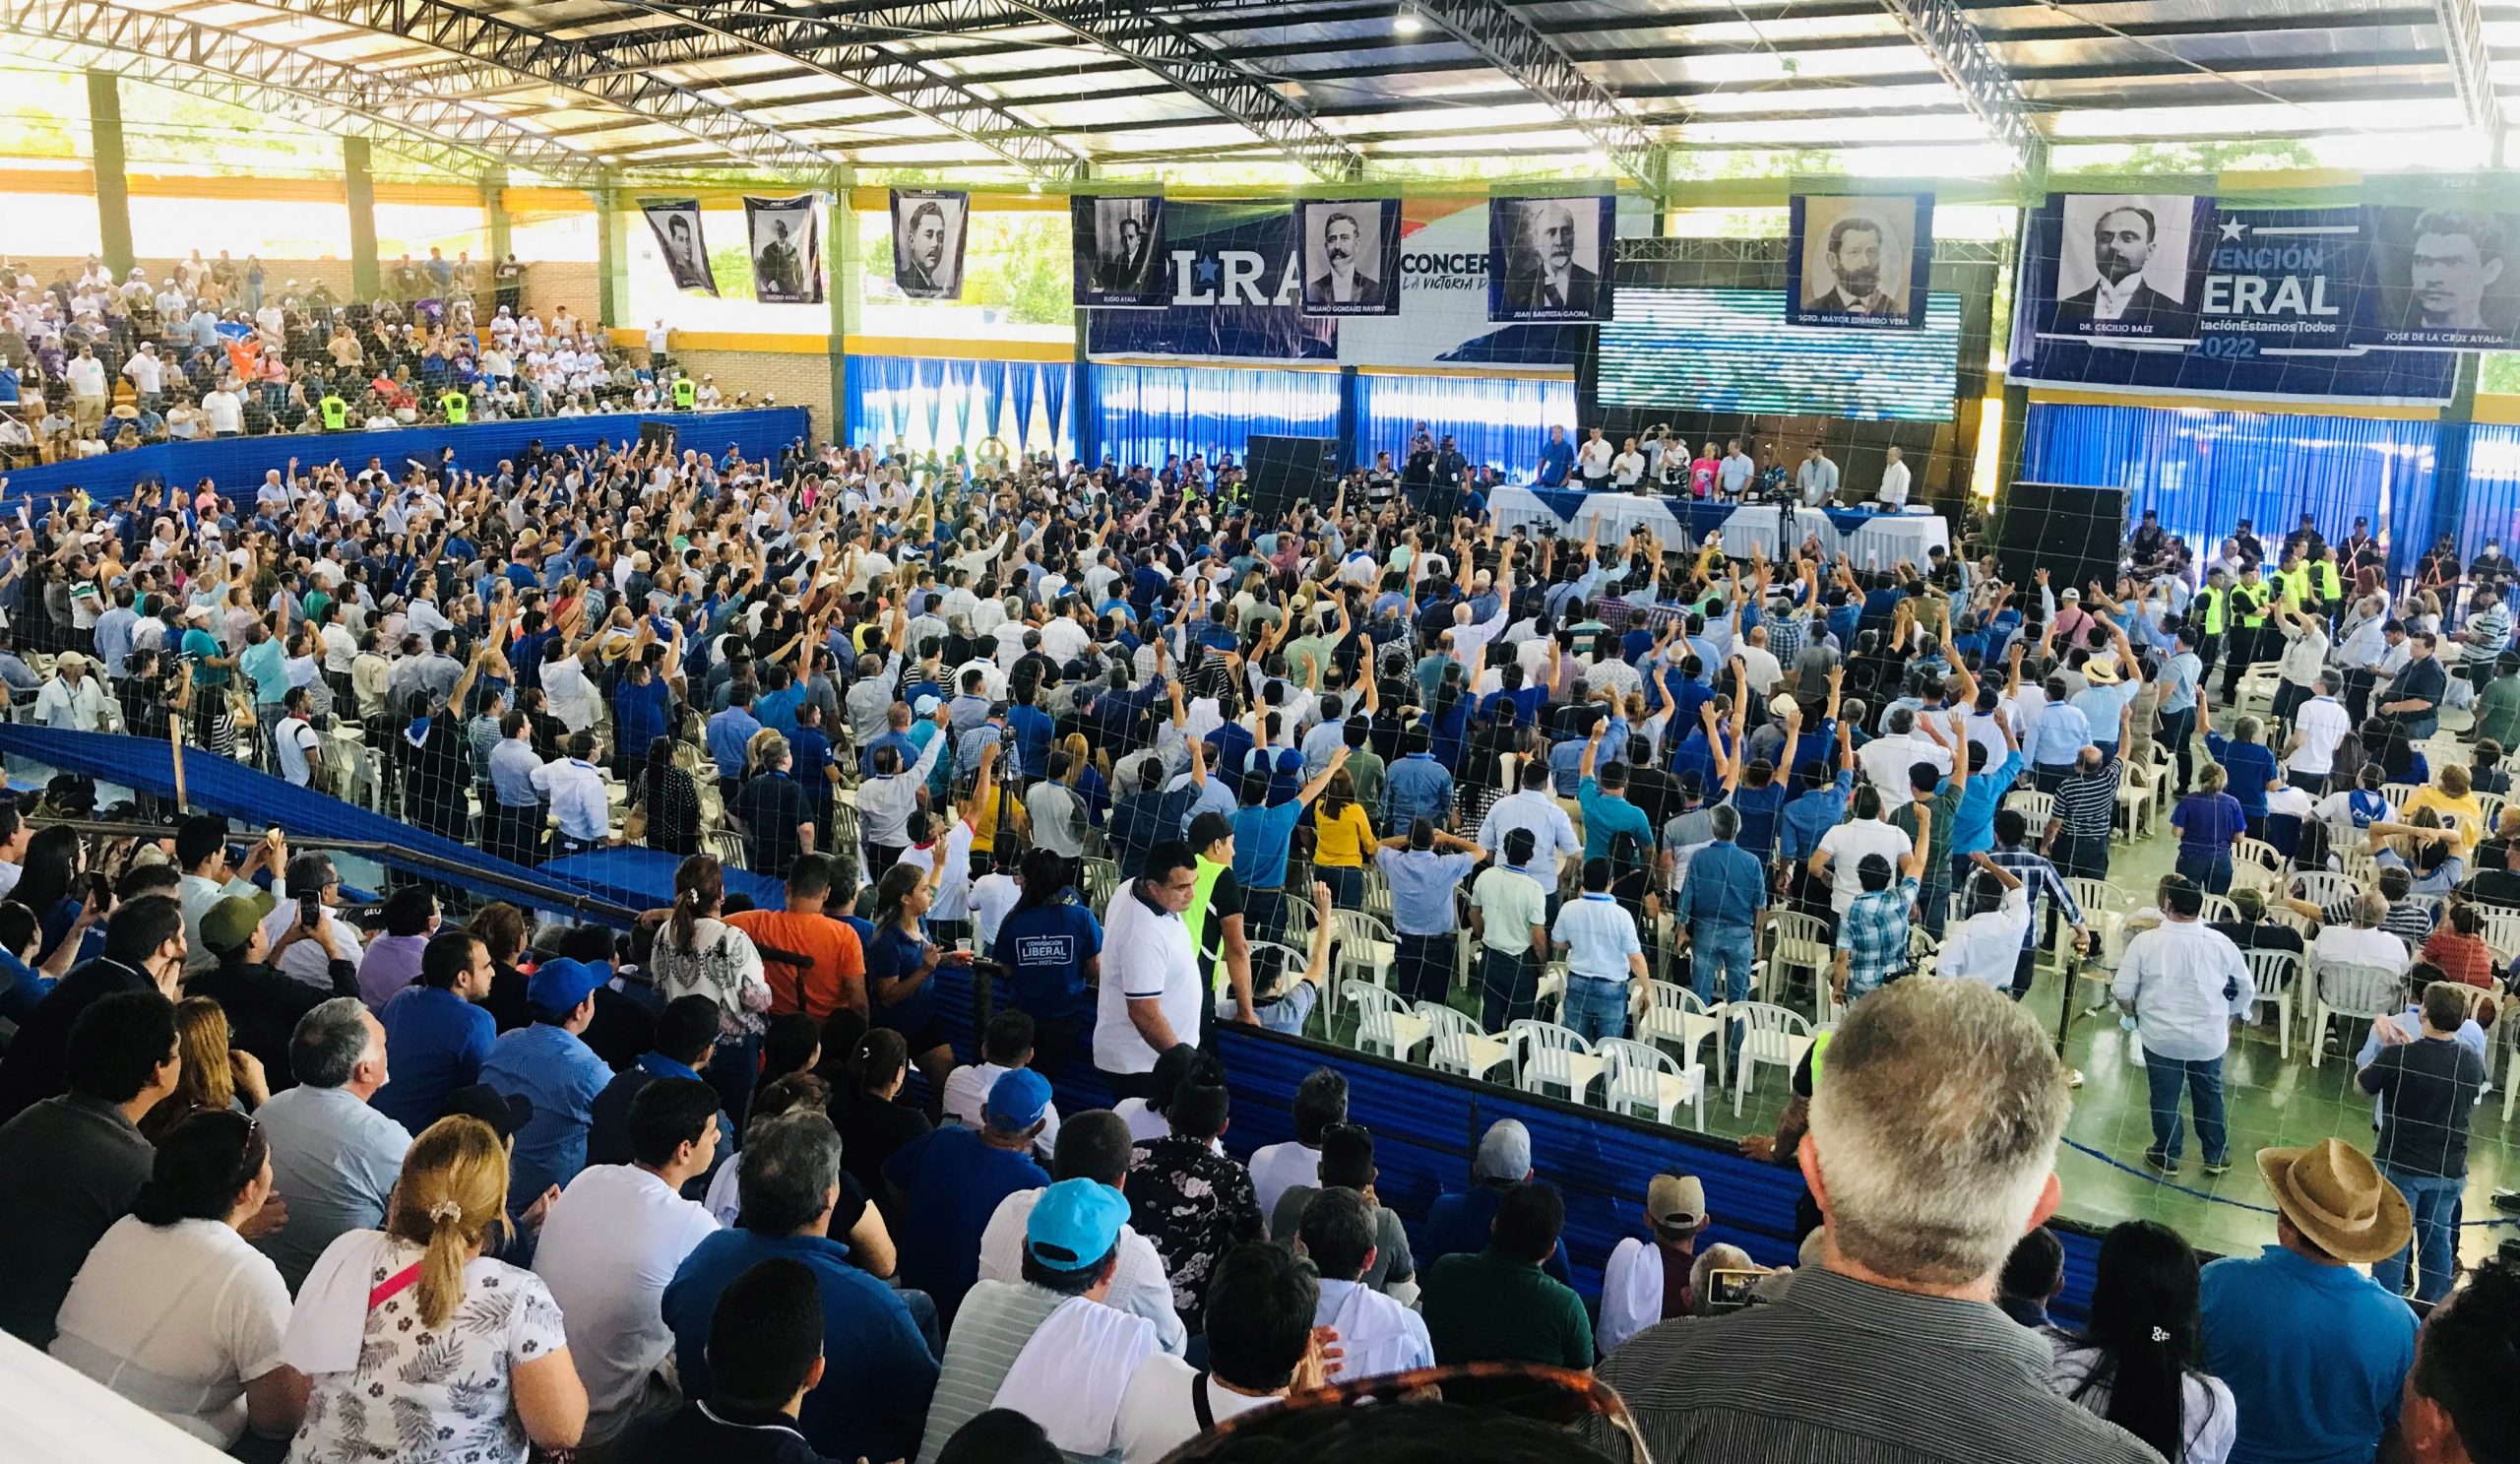
It is not controversial to say that the PLRA is the most important party of the Concertación. Its history, its number of members and voters, and its vast party structure made up of parliamentarians, governors, mayors, and councilmen throughout the country endorse its preeminence among the Concertacionists. But despite its centrality in Paraguayan politics, not much is known about the pathway of its internal electoral life.
In this first installment on the electoral contribution of the PLRA to the Concertación, emphasis is placed on the percentages of participation in the party’s internal elections. Thus, it highlights the different dynamics that make participation vary. For example, it is shown how participation depends on whether the party is in opposition or in government, and whether national or partisan candidacies are at stake.
Let’s go straight to the statistical data, although for a correct reading and exploration of the percentages it is important to sort the different internal elections into three types:
- Internal elections to elect presidential, parliamentary, gubernatorial and departmental candidates;
- Internships to elect party positions;
- Internal elections for party and municipal offices.
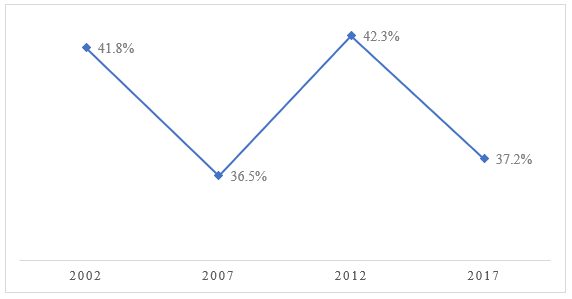
The percentages of participation in the primaries to elect presidential, parliamentary, gubernatorial, and departmental candidates are shown in the following chart.
Figure 1. Participation in the internal elections to elect national candidates (2002-2017)
Source: Prepared by the authors based on data from the PLRA’s TEI.
Here it can be seen that the percentages range between 36% and 42%, where the highest participation (42.3% in 2012) corresponded to the time when the PLRA was in government.
These data may help us to think about what may happen on December 18 in the Concertación’s presidential primaries. Since national (and not party) positions will be at stake, the historical trend of participation in the PLRA is close to 40%. The national roll of the PLRA closed with 1,548,023 affiliated members, so it is expected, at least, a minimum participation of 600,000 liberal voters.
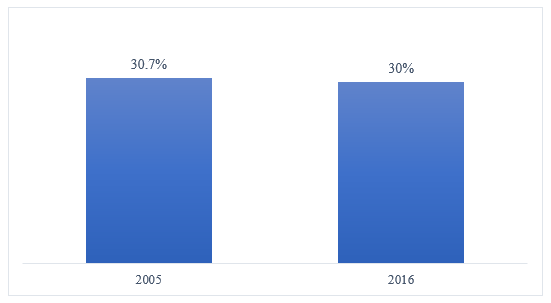
The percentages of the second type of internal elections -those in which only party candidacies were elected- are included in the following graph.
Figure II. Participation in internal elections for party positions (2005 and 2016).
Source: Prepared by the authors based on data from the PLRA’s TEI.
The data show very similar numbers with only a difference of 0.7%, even though 11 years have passed between elections.
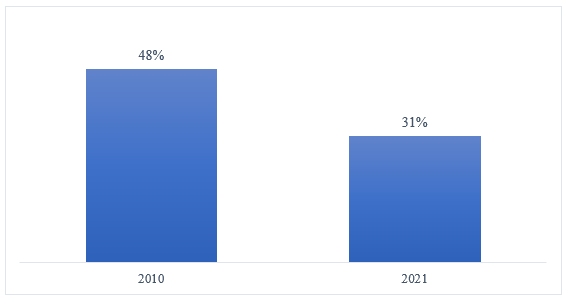
Finally, the percentages of participation in the internal elections where party and municipal candidates were elected simultaneously are included in the following graph.
Figure 3. Participation in internal elections for party and municipal offices (2010 and 2021)
Source: Prepared by the authors based on data from the PLRA’s TEI.
This last graph shows two internal elections in which the same positions (party and municipal) were at stake, although with an important difference in participation between one and the other.
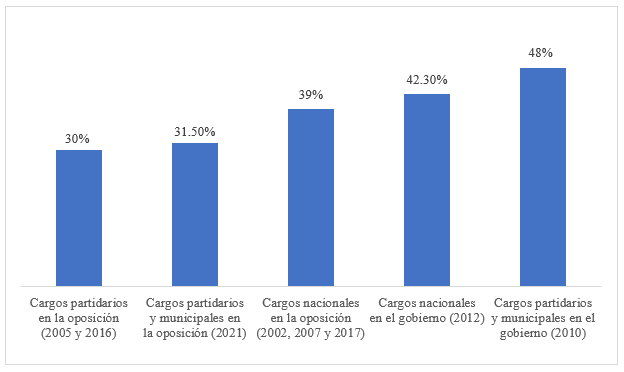
All these data previously exposed show that the percentages of participation in the liberal internals are not affected by the evolution of time but by two variables: the types of positions at stake and the condition of being in the government or in the opposition. The following graph presents a summary of this.
Figure 4. Type of election and participation (2002 to 2021)
Source: Prepared by the authors based on data from the PLRA’s TEI.
Figure 4 shows certain trends. First, when the party was in government (internal elections in 2010 and 2012) participation rose above the historical average because the different party sectors had more resources, positions, and incentives for participation at their disposal.
Secondly, if we leave aside the elections in times of government, we see that the participation in the opposition is not the same in the internal elections for party positions versus the internal elections for national positions. In the partisan primaries where only internal party authorities were elected (year 2005 and 2016) the average participation was 30%. And in the elections in which party and municipal positions were disputed (year 2021) the participation was 31.5%, very similar to the previous case (30%).
However, in the internal elections where presidential, parliamentary, and gubernatorial candidacies were elected (discounting that of 2012 in the government), the average participation rose to almost 40%. Practically a 10% increase in participation with respect to the elections merely for party positions. The incentive of mobilization and participation when national candidacies are at stake (especially the presidential one) clearly generated a plus in the liberal electorate.
In synthesis, participation in the liberal internal elections is not the same in all cases. The analysis of the data from 2002 onwards shows that there is a pattern that explains the mechanics of participation, and it is related to being in the government or the opposition and the type of positions in dispute.
These data may help us to think about what may happen on December 18 in the Concertación’s presidential primaries. Since national (and not party) positions will be at stake, the historical trend of participation in the PLRA is close to 40%. The national roll of the PLRA closed with 1,548,023 affiliated members, so it is expected, at least, a minimum participation of 600,000 liberal voters.
In the second article of this issue, emphasis will be placed on the electoral contribution of the main leader of the PLRA today, Efraín Alegre, to the Concertación, reviewing, to that effect, once again the trajectory of the internal life of the PLRA.
Cover image: Megacadena
